How to turn the data received on my server into graphs?

How to turn the data received on my server into graphs?

by Thomas Permantier -
Number of replies: 2

Hi,


I am a mobile casino game developer. I wish to utilize the data I receive on my server in order to show players some of their statistics.


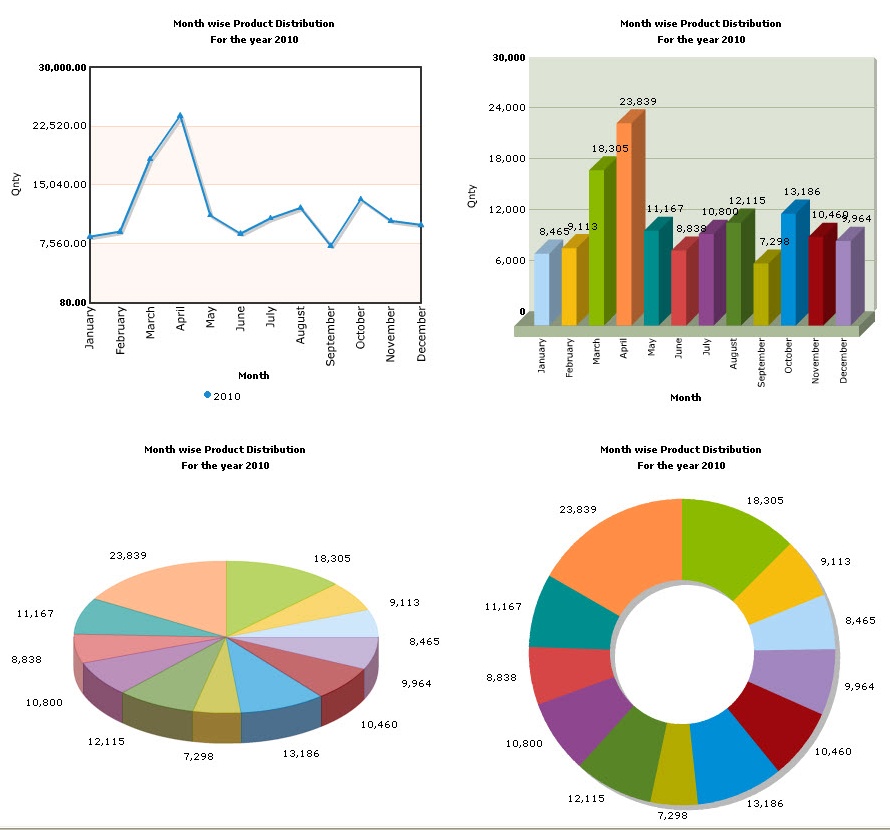
For example, in the player's profile, I want to have a graph showing the player's winning rate per day.


I attached an image showing examples of the kinds of graphs I'd like.


I couldn't find a tool that would allow me to do that. If anyone has any idea, please let me know.


Thank you,

Tom


Graph examples

Average of ratings: -
In reply to Thomas Permantier

Re: How to turn the data received on my server into graphs?

by Nicolas Martignoni -
Picture of Core developers Picture of Documentation writers Picture of Particularly helpful Moodlers Picture of Plugin developers Picture of Testers Picture of Translators

Hi,

Do you mean, on a Moodle installation?

In reply to Nicolas Martignoni

Re: How to turn the data received on my server into graphs?

by ryan sanders -

what programming language are you using?  flash, javascript, html, css, java?  on the client side of things.  that will most likely determined what is available for you. there are lots of "chart" scripts out there for flash, javascript, css, java. to many to count. 

GD graphics library, and imagemagick are server side applications in dealing with images. at one time they were pretty much standard install on nearly every server on internet via web hosting companies. ((it has been a few years since i went looking so i do not know current state of things)) with different frameworks / api's to access the apps from php, perl, cgi, c, java, etc..